Super Bowl LX: The year the Super Bowl went streaming-first

Feb 13, 2026
What that means for reach, measurement, and the new economics of event advertising
Every year, the Super Bowl gives us a snapshot of where American media consumption actually is - not where we think it is, or where it was a year ago. This year’s game delivered a clear verdict: for the first time, more US households watched through streaming platforms than through traditional cable and broadcast television.
That’s the headline finding from MiQ’s TV Intelligence dataset - ACR data from 70M+ US devices tracked through our Sigma platform. And while the how-we-counted matters (more on that below), the implication for advertisers is hard to overstate. The largest live television event in the country is now, by our measurement, a streaming-first event.
Here are the three things that stood out.
1. Streaming is now how a majority of viewers watch the Super Bowl.
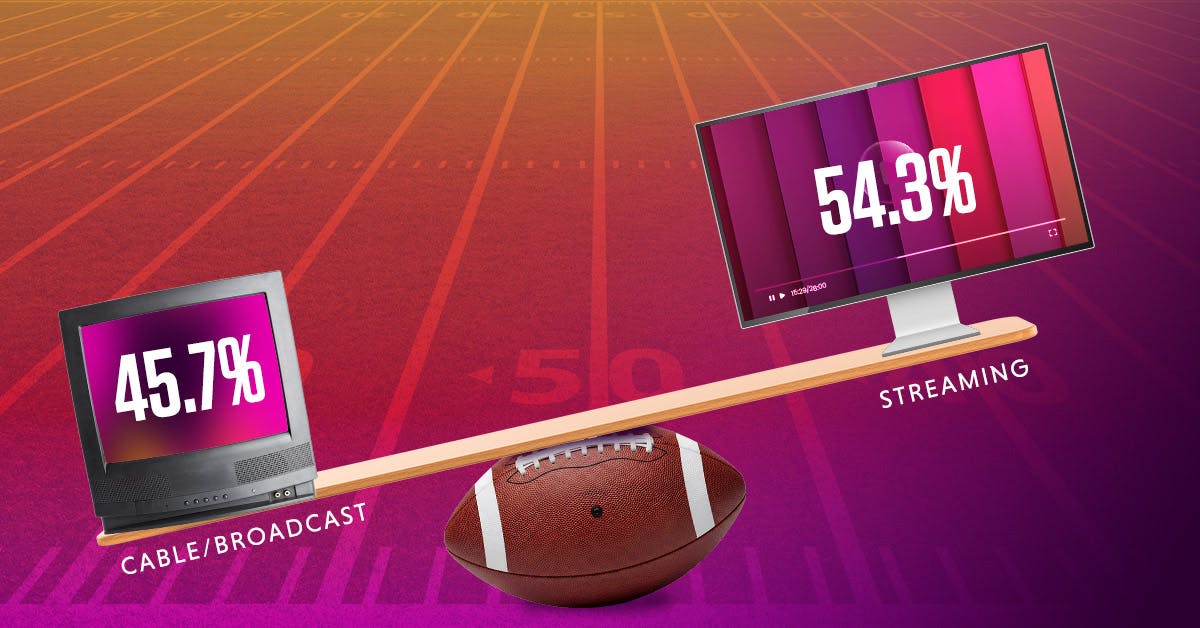
Using MiQ’s analysis of viewership data across 70 million+ TV sets, we analyzed household-level viewing on Super Bowl Sunday (February 8, 2026). We sorted viewers into two groups: those who accessed the game through a traditional cable or broadcast feed, and those who watched via a streaming app on a smart TV or connected device.
The result: approximately 54% of households watched via streaming. Traditional cable and broadcast accounted for 46%.

An important methodological note: our streaming figure includes virtual MVPDs - YouTube TV, Hulu Live, Sling, etc. Nielsen rolls vMVPD viewing into its broadcast and cable totals, meaning Nielsen’s numbers for this game would not show a streaming majority. We made a different choice, and here’s why: these services are internet-delivered, app-based, and multi-device. More importantly for our audience, they’re accessible to advertisers through programmatic buying platforms like The Trade Desk and DV360. From a media planning and buying standpoint, they behave like streaming inventory. We believe this classification better reflects how much of the programmatic industry transacts.
Even setting the vMVPD debate aside, Peacock alone captured over 21% of viewership in our dataset - a remarkable figure for a single streaming platform during a live broadcast.
A few other details worth noting: traditional viewers watched longer per session (96 minutes vs. 81 minutes for streaming), and we excluded a small number of dual-mode households that watched through both streaming and traditional feeds.
The practical takeaway is straightforward. With Super Bowl viewership now fragmented across Peacock, YouTube TV, and multiple other streaming platforms, cross-platform measurement and deduplication have become table stakes.
2. AI and tech dominated the ad lineup
The composition of this year’s advertiser roster tells its own story about where the economy is heading.
Seven AI-first companies bought in-game airtime: OpenAI, Anthropic, Google, Amazon, Meta, Genspark, and Base44. Add AI-adjacent brands like Salesforce, Microsoft, and Artlist, and tech/AI represented roughly 30% of all brands advertising during the game - up from 11% in 2020. One of the more striking creative choices: Anthropic ran a series of spots directly challenging OpenAI’s decision to introduce ads into ChatGPT, taking the on-field rivalry to the screen.
That tech surge came at the direct expense of legacy Super Bowl categories. Automotive, historically the event’s anchor vertical, collapsed from 16% of brands in 2020 to just 2%; entertainment dropped from 24% to 8% of brands. Financial services and health/pharma brands, meanwhile, all expanded their presence during the game bookending the Bad Bunny concert.

Within the AI cohort, the creative strategies were notably varied. Several brands - Squarespace, Wix, Artlist, OpenAI - competed to own the “creator class” positioning. Others - Google, Salesforce, Peloton - took a humanization approach, framing AI as emotionally grounded rather than technically abstract. Salesforce and Adobe leaned into consumerized B2B creative, with Salesforce enlisting MrBeast.
The humanization approach appears to have generated a strong audience response, consistent with Pew Research’s October 2025 finding that Americans express significantly more concern than excitement surrounding AI.
3. The broadcast spot is now one component of a larger activation
With in-game spots reportedly running $8 - 12 million per 30 seconds, the most sophisticated advertisers treated their broadcast spot as a single element within a multi-phase activation: pre-game teasers, hero spot, creator amplification, post-game commerce activation, and measurement.
The creative ambition matched the investment. Taika Waititi directed three spots (Lay’s, Xfinity, Pepsi), Yorgos Lanthimos directed two (Squarespace, Grubhub), and Spike Jonze, Joseph Kosinski, and Henry-Alex Rubin each helmed campaigns for Instacart, Michelob ULTRA, and Redfin/Rocket, respectively.

Meanwhile, some brands bypassed the broadcast entirely. Nissan and Jeep both premiered their Super Bowl-adjacent campaigns on YouTube and social media. e.l.f. Cosmetics ran a two-minute telenovela-style spot on Peacock’s adjacent content rather than paying for in-game inventory. These approaches delivered cultural presence at a fraction of the cost - and underscore that the Super Bowl is increasingly a media moment, not a single media buy.
What this means
Super Bowl LX confirmed what the trend data has been pointing toward. The implications are specific:
The measurement gap is now a business problem. If you’re only measuring broadcast delivery for a Super Bowl campaign, you’re missing a significant portion of viewership. Unified cross-platform measurement - connecting CTV, linear, social, and creator touchpoints - isn’t a capability flex, it’s the minimum viable approach for understanding whether your investment actually worked.
vMVPD inventory is addressable in ways broadcast isn’t. YouTube TV and Hulu Live audiences can be planned against, targeted, and measured with a precision that linear broadcast can’t match. Advertisers with access to programmatic CTV can extend a live sports strategy beyond the 30-second spot and into targeted pre-roll, companion placements, and post-game retargeting.
Planning needs to start from how people actually watch, browse, and buy, not how they used to. The 54/46 streaming-traditional split isn’t a blip. It’s the new baseline, and it will tilt further next year. Campaign planning, audience strategy, and budget allocation should reflect the screen people are actually on.
Learn more about MiQ’s Advanced TV and MiQ Sigma, our AI-powered operating system.
Methodology and data sources
MiQ TV Intelligence data: ACR (Automatic Content Recognition) and STB (Set-Top Box) data from 70M+ US devices tracked through MiQ’s Sigma platform on February 8, 2026. Analysis covers device-level viewing behavior across streaming and traditional TV platforms, including reach, session duration, platform distribution, and network affiliates. Virtual MVPDs (YouTube TV, Hulu Live, Sling, Fubo) are classified as streaming based on their delivery method, app-based user experience, and accessibility through programmatic buying platforms. A small number of households that viewed through both streaming and traditional feeds were excluded.
Limitations: this data captures smart TV and connected device viewing; it does not capture out-of-home viewing, mobile-only viewing, or households using non-smart televisions without set-top box devices.
Super Bowl ad creative analysis: Analysis of 111 ad files representing 83 unique campaigns sourced from the YouTube AdBlitz Super Bowl 60 playlist, accessed on February 9th, 2026. Each campaign was assessed for brand, category, creative approach, talent, and strategic positioning. 2020 comparison data sourced from Superbowl-Ads.com using the same framework.
Viewership context: Super Bowl LX drew 124.9 million viewers across NBC, Peacock, and Telemundo (Nielsen), making it the second most-watched Super Bowl in history.


